Did Claude Code Get Worse? Read Your Session Logs Before You Turn Effort to Max
Your Claude Code session logs show whether your setup changed and whether the model is skipping work or ignoring work it already did. Higher effort fits only the first.
Sometime between the evening of October 18 and the next afternoon, one Claude Code user's corrected answers jumped from 5.2% to 25.4%.
Across the same window, the first request of all 43 of their sessions read exactly 29,503 tokens from the prompt cache, the copy the API keeps of a request it has already seen. Both numbers came from the same local logs, and the second one said Claude Code's own setup had not changed.
Claude Code keeps a JSONL log of every session on your own disk. Two readings from those logs answer the question "did Claude Code get worse?" One shows whether anything in your setup changed. The other shows whether the model is doing less work or ignoring work it already did.
Effort is the Claude Code setting, from low to max, that sets how long the model thinks before it acts. Raising it fits only one of those two failures: the model doing less.
Your reading decides your next move. After a bad week you have three: raise effort, switch models, or rewrite your CLAUDE.md and hooks.
Each one costs something. Higher effort spends quota. A model switch drops the cache. A rewritten setup leaves you nothing clean to compare against.
The logs can tell you which move fits before you spend anything.
Where Claude Code keeps the record
Every session is a file at ~/.claude/projects/<project>/<session-id>.jsonl. The folder name is your working directory with the slashes turned into dashes, per Claude Code's session docs.
Each line is one piece of the session: your prompt, a block of a model response (its text or a tool call), or a tool result. One response can span several lines.
Three parts of a line matter here. Each model response carries message.model and a message.usage block with the token counts. Every line carries the version of Claude Code that wrote it. Tool calls appear as tool_use blocks with a name such as Read, Edit or Bash, per a field reference built from the files.
Two cautions come first.
Claude Code deletes transcripts older than 30 days by default, silently, so a bad stretch from last month may already be gone.
The session docs also warn that the entry format "is internal to Claude Code and changes between versions." Any script you write against it can break on an update.
Did anything on your side change?
The first reading comes from the prompt cache, so it helps to picture what that is.
Each time you send a message, Claude Code re-sends the whole conversation. The request holds its instructions, the tool definitions, every earlier message, and your new one. Most of that request is identical to the last one. The API keeps a copy of the part it has already seen. Build to Launch's guide to Claude Code token optimization covers what else fills those requests.
The copy only counts when the start of the request matches byte for byte.
The API reads a request in a fixed order, tools, then system prompt, then messages. Claude Code's caching docs put it plainly: "The match is exact, so a change anywhere in the prefix recomputes everything after it."
Claude Code puts the parts that rarely change at the front. Anthropic's engineers list the order: the static system prompt and tools first, then CLAUDE.md, then session context, then the conversation.
The first block is shared across all your sessions, so a fresh session's first request reads it straight from the cache.
So the cache read on a session's first request is a fingerprint.
In the usage block it is cache_read_input_tokens, the tokens already cached from a recent request. If the same number shows up session after session, Claude Code sent the same instructions and the same tools every time.
The reporter's 29,503 held across 43 sessions. Their Claude Code had not changed.
The fingerprint moves for specific reasons, so a new number on the day things went wrong points at one of them. Claude Code's docs list them:
- switching models
- turning on fast mode
- connecting or removing an MCP server
- enabling or disabling a plugin
- denying an entire tool
- upgrading Claude Code
The fingerprint also has blind spots. Your CLAUDE.md and Claude Code's memory index (the file listing the notes it saves for a project) sit in a later layer, cached per project, so editing them does not move the block every session shares: Claude Code's instructions and tools. The reporter's logs show it. Their number held even on a day their memory index changed.
Check those files by their own dates, as the October reporter did. Their CLAUDE.md and memory index were byte-identical across part of the window, and no hook edit fell inside it.
Two more things on your side are worth a glance.
The model field shows whether a session quietly moved. When a safety classifier flags a request, Claude Code switches the session to Opus 4.8 or Opus 5 and stays there.
And Opus 5.5 starts at medium effort, ignoring an effortLevel saved in your user settings for older models, so a session can run at medium even when you once chose higher.
Two ways a model gets worse, and how each shows in the log
Once your side checks out, the question becomes what kind of worse you are seeing.
Two documented cases from this year look the same from the chair: a model that suddenly needs correcting. In the log they look opposite.
Table: Two failure patterns in Claude Code session logs
| Less work | Work ignored | |
|---|---|---|
| Case | February to March 2026 | October 2026 |
| Reading before acting | Reads per edit fell, 6.6 to 2.0 | Tool calls held, median 6 per answer |
| Thinking | Fell, by the reporter's estimate | Rose at high effort, 1,060 to 1,450 tokens |
| Typical miss | Edits to files not read, 6.2% to 33.7% | Ignored context already loaded, 1.14 to 9.36 per 100 prompts |
| Higher effort | Fit part of the cause | Every level got worse |
Corrections rise in both cases. The rows about reading and thinking tell them apart.
April: the model read less, and effort was the lever
Stella Laurenzo, director of the AI group at AMD, measured the first case. Her team had Claude analyze 6,852 of their own session files with 234,760 tool calls.
In late January the model read 6.6 times for every edit it made, and by March it read 2.0 times.
A third of its edits went to files it had not read recently.
That shape is a model doing less work. It read less, then edited blind.
Anthropic's postmortem in April covered the same weeks. The postmortem traced the quality reports to three changes. The first was a setting. On March 4 Anthropic had lowered Claude Code's default effort from high to medium. It later called the change "the wrong tradeoff" and reverted it on April 7.
So for that failure, effort was the right dial.
The postmortem names two more causes. One was a bug that kept clearing the model's earlier reasoning. The other was a system-prompt line limiting response length. Neither involved effort.
Even in April, effort covered only part of the problem.
Will higher effort fix it? October says no
October looks different in the same fields.
The reporter of issue #105112 found the model doing as much work as before. The median was 6 tool calls per answer in both weeks. At high effort, median thinking per answer rose from 1,060 to 1,450 tokens.
The answers still went wrong.
The model read the file that settled the question. Then it answered against it. In labels assigned blind to the date, "ignored context already loaded or on disk" rose from 1.14 to 9.36 per 100 prompts. That was the largest single type of failure.
Then the reporter split corrections by effort level.
Every level got worse after the step.
Table: Share of answers corrected, by effort level (issue #105112)
| Effort | Before Oct 19 | Oct 19 to 25 |
|---|---|---|
| Medium | 5.3% of 3,524 | 21.5% of 172 |
| High | 5.4% of 1,161 | 26.6% of 533 |
| xhigh | 4.8% of 930 | 20.1% of 159 |
| Max | 5.6% of 108 | 50.0% of 36 |
More thinking did not lower the rate at any level.
A skeptic has fair points here. This is one person's script counting their own corrections. The max row rests on 36 answers. Someone who has just been burned also checks harder. And outside data disagrees: LiveNerf is a tracker that asks Opus 5.5 the same 78 questions every day through Claude Code. It has detected no change in four 10-day windows since launch week.
The rest of the evidence holds up against those points.
The rise appears at every effort level. So it does not rest on the 36. The first answers of new sessions, which no earlier correction could color, rose from 6.0% to 21.8%. On the reporter's cleanest measure, first answers and fresh questions before any correction, the rate still nearly tripled. It went from 5.2% of 3,369 to 15.4% of 390.
A second user ran a cruder keyword count, by their own description. The share of their messages carrying a correction or an angry word rose from 24.8% (October 8 to 18) to 39.1% the week after. It eased to 32.1% on October 26 and 27. All 49,275 of their model's responses came from claude-opus-5-5, so no fallback explains it.
LiveNerf measures something narrower than a working session. It asks single questions with known answers. It detects shifts of about 7.5 points per window. Its own validation found that swapping Opus 5 in for Opus 5.5 "was not distinguishable" at its confidence level.
So the tracker and the reporters can both be right about what each one measured.
None of these numbers prove what happens in your sessions. The useful step is to run the same count on your own logs.
If yours show the October pattern, effort max is an expensive way to change nothing.
Effort max spends more of your quota per answer, because it buys more thinking. On Opus 5.5 with a subscription or an API key, an effort change keeps the prompt cache, so the quota is the whole cost. (On most other models, and through Bedrock or a gateway, an effort change does break the cache.) The October table shows what it bought.
Run both readings on your own sessions
The commands below use jq and the fields described above.
The first one adapts a query by Gabriel Anhaia and adds the version field. Run it from a plain terminal, outside Claude Code, so a new session doesn't become the newest file.
- Print the first response of your last 20 sessions. Look for a
readvalue that stays the same across days, and for any change inmodelorversion.writeiscache_creation_input_tokens, the part sent fresh because no recent copy matched. A copy also expires after a break, after one hour on a subscription and five minutes with an API key, so compare sessions you started while working steadily. Inside Claude Code,/usageshows aPrompt cache (main)line that, from version 2.1.260, names the likely cause of the last cache miss.
for f in $(ls -t ~/.claude/projects/*/*.jsonl | head -20); do
  jq -c -s '
    map(select(.type == "assistant" and .message.usage))
    | first // empty
    | {t: .timestamp, version: .version, model: .message.model,
       read: .message.usage.cache_read_input_tokens,
       write: .message.usage.cache_creation_input_tokens}
  ' "$f"
done
-
Check your own files by date. List when CLAUDE.md, your hooks and your memory files last changed. See whether any change lands on the day things went wrong.
-
Count reads and edits per session. A falling share of Read calls next to Edit and Write calls is the April pattern.
for f in $(ls -t ~/.claude/projects/*/*.jsonl | head -20); do
  jq -r 'select(.type == "assistant") | .message.content[]?
         | select(.type == "tool_use") | .name' "$f" \
  | awk -v s="$(basename "$f")" '$1=="Read"{r++} $1=="Edit"||$1=="Write"{e++}
         END{printf "%s reads=%d edits=%d\n", s, r, e}'
done
- Count your corrections per day. The second user's method was a keyword count of their own messages ("why", "I said", "again", "stop"). Keep the word list fixed so the days compare fairly. You can also open a fresh session and ask Claude to compute it from the logs, which is how Laurenzo's report was produced.
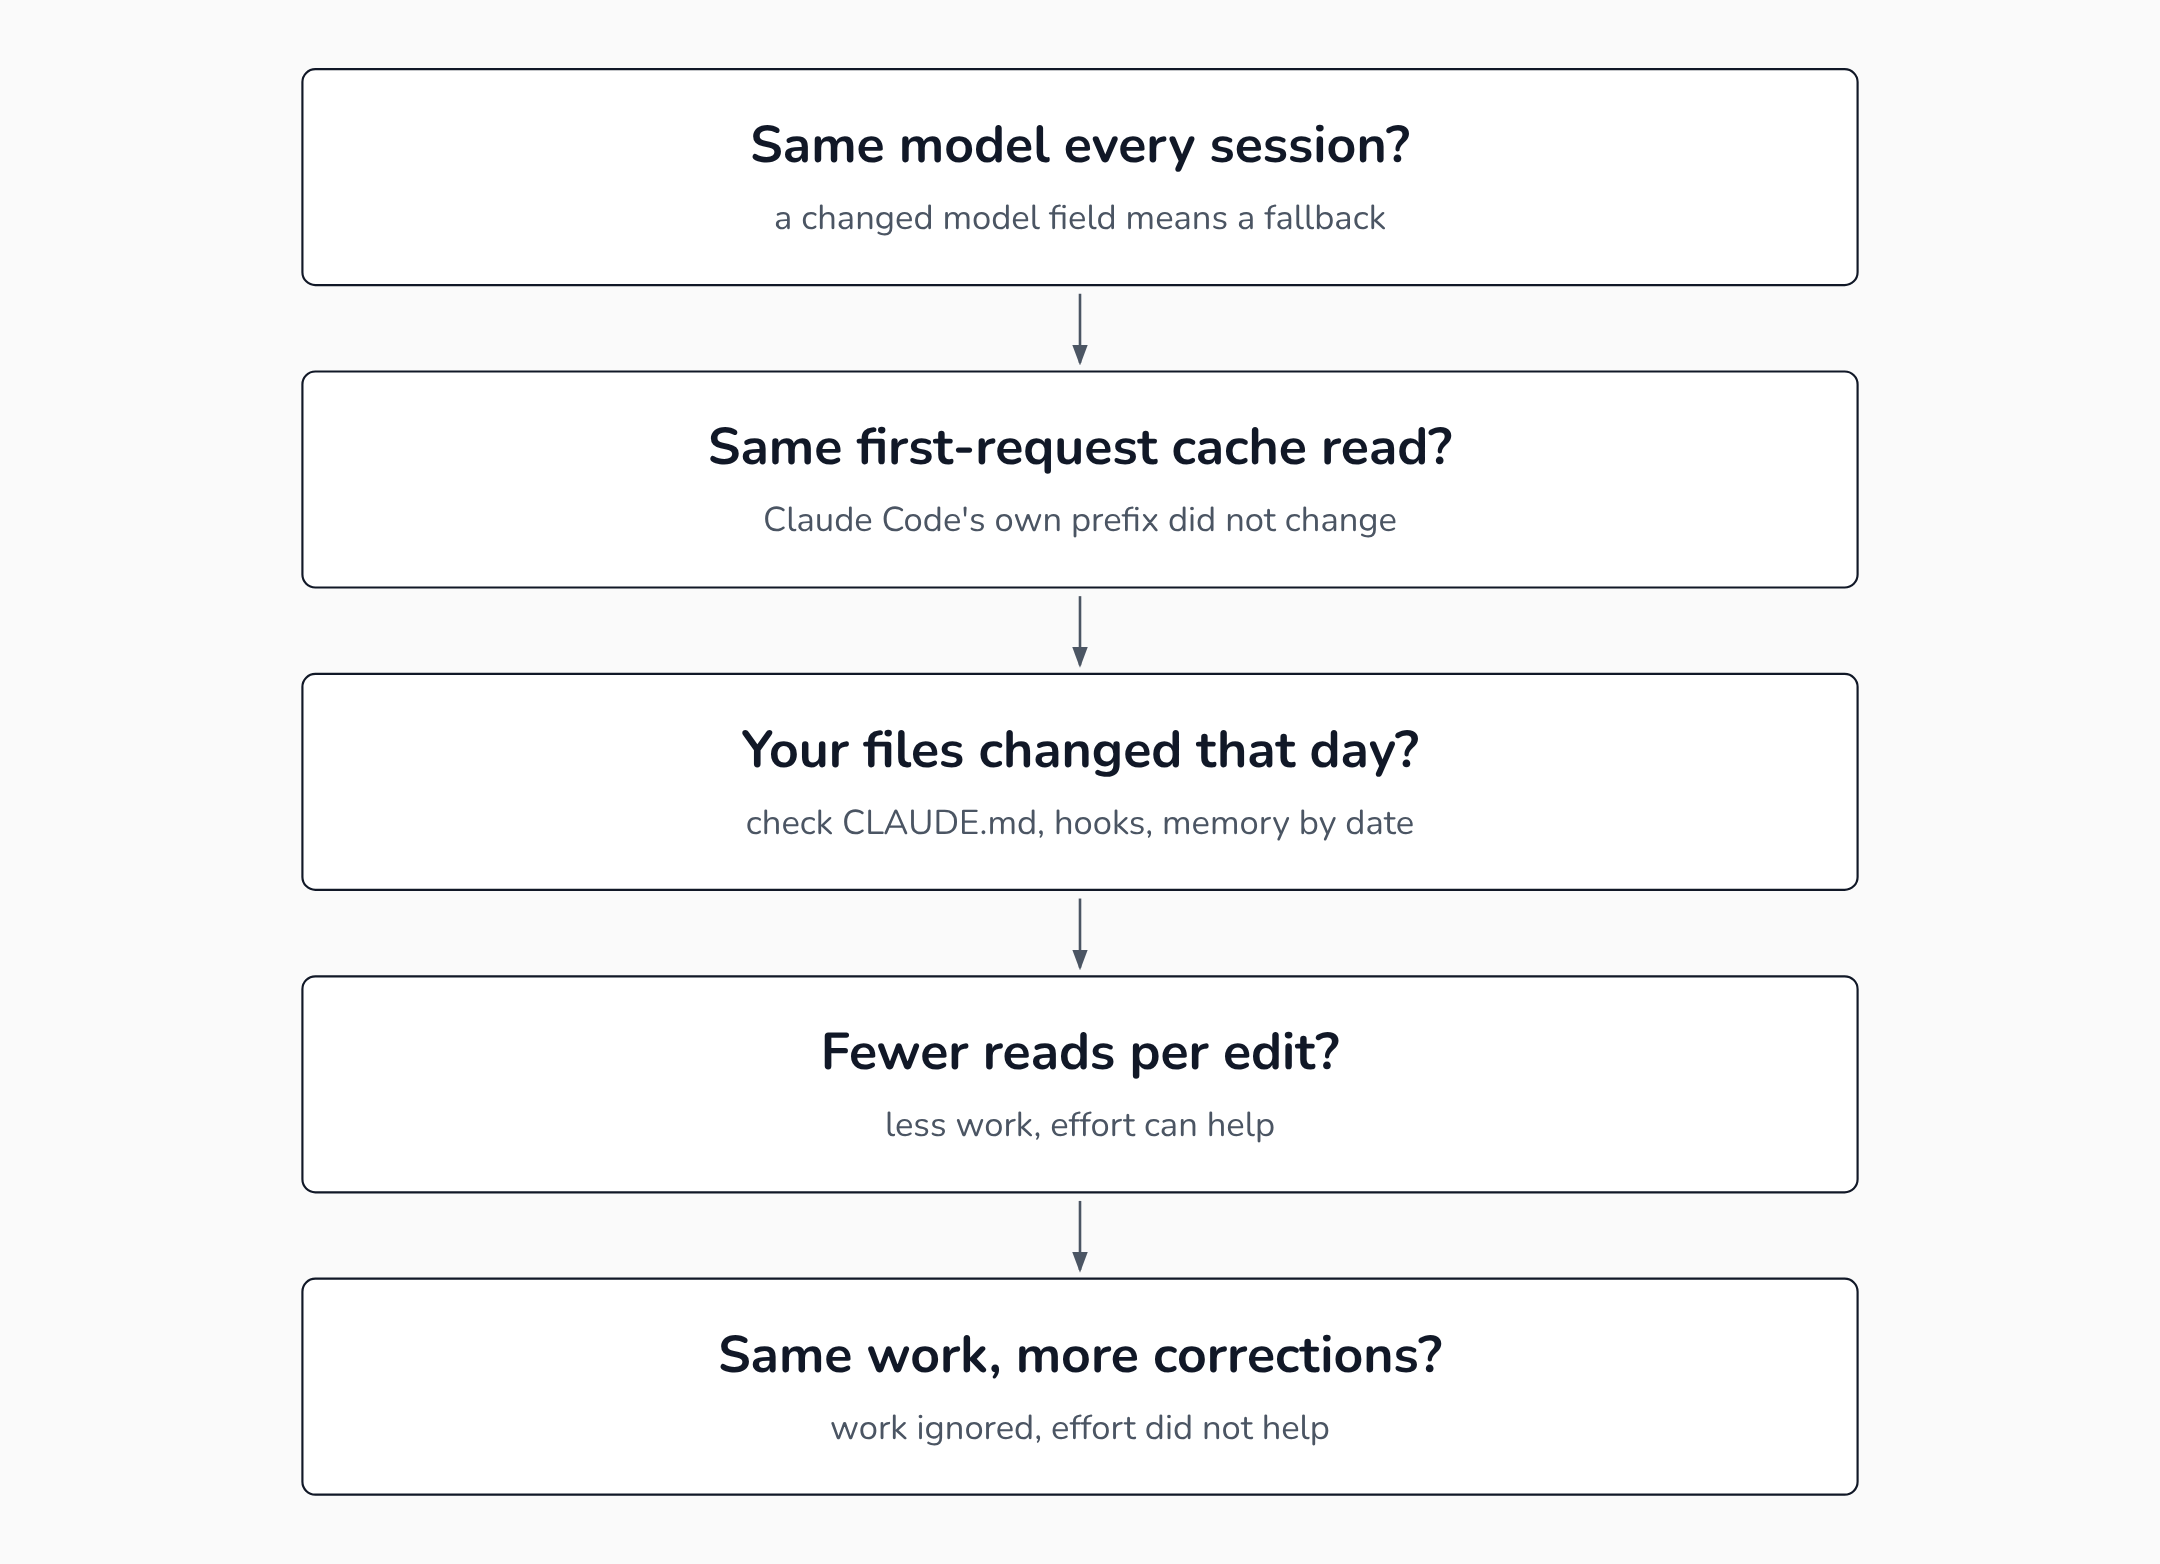 Rule out your own setup first, then let the work pattern decide whether effort is worth spending.
If you go on to sum usage across whole sessions, count each response once, by its message.id.
Claude Code writes one line per content block, and every line of the same response carries the same usage. So a naive sum counts tokens several times.
What to do when the log says the model ignored what it read
Start by leaving your setup alone.
The October reporter cut their instructions and memory index below their September size and removed eleven hooks on November 1. The rate did not come back down. A rewrite in the middle of a measurement also destroys the before-and-after you need.
Next, test a change you can measure.
The original post behind this diagnosis suggests pasting the deciding requirement into your own message, instead of relying on the model to read it from a file. Nobody has published a test of that yet. So treat it as an experiment. Try it for a few days and watch whether your correction count moves.
Then report it with numbers.
Anthropic's April postmortem credits users who sent /feedback or posted "specific, reproducible examples" with finding the causes. A report that says "first-request cache read unchanged at N tokens, corrections up from X% to Y%, request ID attached" gives an engineer something to look up.
As of November 20, this research found no published explanation from Anthropic for the October step.
Until one appears, take the reading while the bad week is still on disk. The 30-day cleanup will delete it.
FAQ
Where are Claude Code session logs stored?
Claude Code stores each session as a JSONL file at ~/.claude/projects/<project>/<session-id>.jsonl, per its session docs. Claude Code deletes transcripts older than 30 days by default. The cleanupPeriodDays setting changes that limit.
Does Anthropic lower model quality on purpose?
Anthropic says it does not. Its April 2026 postmortem states "We never intentionally degrade our models," and traces that spring's reports to three changes in Claude Code: a lower default effort, a bug that dropped earlier reasoning, and a system-prompt line limiting length.
Is Opus 5.5 nerfed?
No public tracker has shown it. LiveNerf detected no change through November 19, 2026, though in its own validation a swap of Opus 5 for Opus 5.5 was not distinguishable. Two users measured a step in their own Claude Code logs from October 19. No explanation had been published as of November 20.
How do I know which model actually answered?
Each model response in the log carries a model field. After a safety-classifier flag, Claude Code moves the session to Opus 4.8 or Opus 5 and keeps the flagged request's effort level, so a changed model value in your log marks that switch.
Sources
- GitHub issue #105112: Opus 5.5 since Oct 19, corrected answers 5.2% to 25.4%
- GitHub issue #105477: Opus 5.5 in Claude Code regressed since the week of Oct 19
- GitHub issue #42796: Claude Code is unusable for complex engineering tasks with the Feb updates
- Anthropic: An update on recent Claude Code quality reports
- Claude Code docs: Manage sessions
- Claude Code docs: All settings
- Claude Code docs: How Claude Code uses prompt caching
- Claude API docs: Prompt caching
- Anthropic: Lessons from building Claude Code, prompt caching is everything
- Claude Code docs: Model configuration
- 鸭哥 (@grapeot) on X: the original log post
- LiveNerf
- Gabriel Anhaia: Do parallel Claude Code sessions share a prompt cache?
- The Register: AMD's AI director slams Claude Code
- Samuel Lawrentz: Your Claude Code bill is 94% cache hits
- claude-dev.tools: Claude Code JSONL transcript format explained
- Build to Launch: Claude Code token optimization
- Build to Launch: The Claude Hub
Links
- GitHub issue #105112, "Opus 5.5 since Oct 19: does the research, then answers against it" (documentation)
- GitHub issue #105477, "Opus 5.5 in Claude Code regressed since the week of Oct 19" (documentation)
- GitHub issue #42796, "Claude Code is unusable for complex engineering tasks with the Feb updates" (documentation)
- Anthropic, "An update on recent Claude Code quality reports" (documentation)
- Claude Code docs, "Manage sessions" (documentation)
- Claude Code docs, "All settings" (`cleanupPeriodDays`) (documentation)
- Claude Code docs, "How Claude Code uses prompt caching" (documentation)
- Claude API docs, "Prompt caching" (documentation)
- Anthropic (claude.com blog), "Lessons from building Claude Code: Prompt caching is everything" (documentation)
- Claude Code docs, "Model configuration" (documentation)
- X post by 鸭哥 (@grapeot), the original post behind the intel note (article)
- LiveNerf repository README (article)
- Gabriel Anhaia, "Do Parallel Claude Code Sessions Share a Prompt Cache? Not Across Worktrees", DEV Community (article)
- Samuel Lawrentz, "Your Claude Code Bill Is 94% Cache Hits. The Rest Is Coffee Breaks." (article)
- claude-dev.tools, "Claude Code JSONL transcript format explained" (article)
- The Register, "AMD's AI director slams Claude Code for becoming dumber and lazier since last update" (article)
- Build to Launch, "Claude Code token optimization" (article)
- Build to Launch, "The Claude Hub" (article)
New guides on building with AI come in the Build to Launch newsletter.
More guides
Your AI-Built Contact Form Says "Message Sent!" 27 of 105 Sent Nothing. Test the Inbox
A study of 105 Lovable and Bolt contact forms found 27 that showed "Message sent!" and sent nothing. Even a form that does send can fail after the click, so the only test that proves a form works is a real message arriving in the inbox you read.
Fable 5.2 vs Opus 5.5: Raise Effort Before You Switch Models
Anthropic says to start on Opus 5.5 and switch models last. Give Claude a check, raise effort one level, then try Fable 5.2, which costs about the same as Opus at max in independent tests, not half.
Vibe Coding Development Services: A €3,000 and a €12,000 Quote Can Buy the Same Screens
The screens in an agency quote are what your AI tool already builds. Compare vibe coding quotes on the five lines a prototype leaves out: data locked to each user, a security review, deployment, code ownership and fixes after handoff.